
Markets and Economy
2025 Fixed Income Outlook – Bonds Offer Incentive to Diversify
5 minute read time
Higher Yields, Steeper Curve are Silver Lining to 4th Quarter Bond Rout
2024 was a great year for bonds – right up until the fourth quarter. In fact, the 10-year Treasury yield bottomed in September right about the time the Federal Reserve delivered a larger-than-usual 0.50% rate cut, its first reduction since 2020. Then, the Fed expected more cuts to come, with the Fed Funds rate projected to reach 3.50% by the end of 2025 as concerns about a softening labor market took precedence.
But investors began to reassess their expectations for further rate cuts almost immediately, and the 10-year yield rose 0.80% in the fourth quarter to finish at 4.58%. The result was a 2.1% decline for the Bloomberg US Aggregate Intermediate bond index in Q4, bringing the full year return to a modest 2.5%.
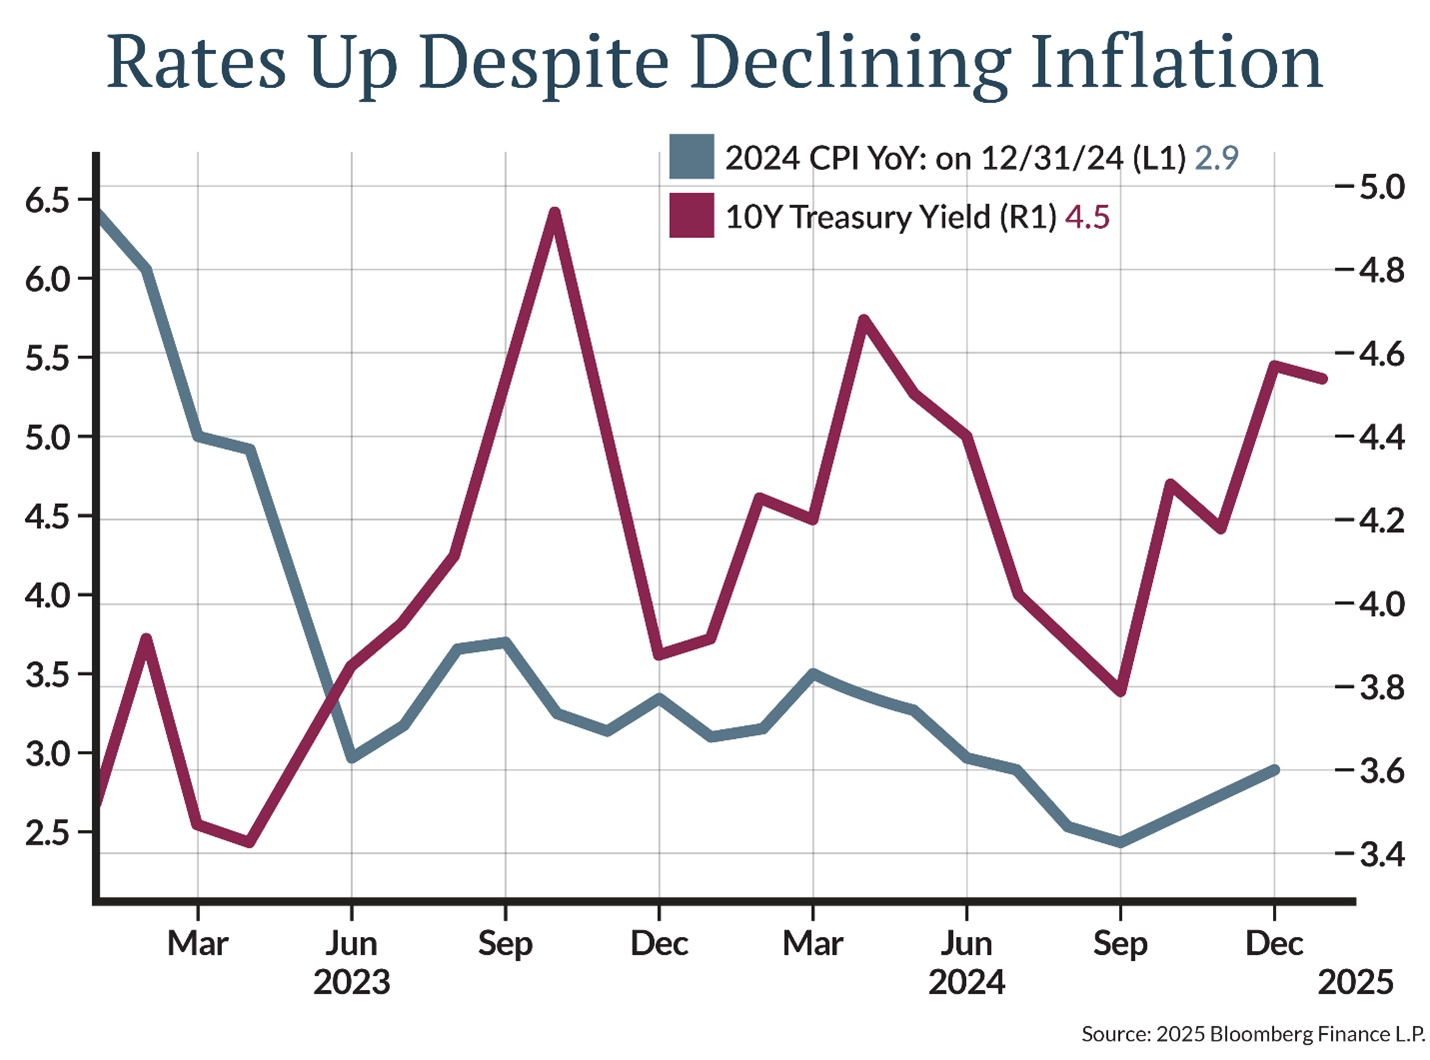
The about face in yields and investor sentiment can be attributed to higher-than-expected inflation readings last fall and uncertainty over how the new administration’s policies will affect growth and inflation. At its December meeting, Fed officials said they expect prices to rise by 2.5% next year, up from 2.1% just a few months prior. Minutes of the meeting showed that Fed officials believe “upside risks to the inflation outlook had increased,” partly due to policy changes including proposed curbs on immigration, tax cuts, and tariffs.
Still, the increase in yields comes after considerable progress on inflation [Figure 1]. The consumer price index (CPI) rose 2.9% year-over-year in December, above the Fed’s 2% target but trending in the right direction. With the Fed committed to keep a restrictive policy stance until further progress on inflation is made, we believe the market now offers an attractive entry point to lock in yields of 4%-5%, well above the long run rate of inflation.
Longer-term yields rose more than short-term yields in Q4, ending a 26-month period when the yield curve was inverted. The normalizing curve once again rewards investors for stepping out of cash.
Further steeping could occur if the Fed returns to an easing bias, with lower short-term rates providing a potential tailwind for bond investors.
Download the 2025 Investment Outlook
Download a copy of the full report providing our outlook on the economy, markets and how we’re currently positioning portfolios.
DOWNLOAD HERE to download the 2025 Alternatives Outlook.Cautious On Credit
While we are excited about the prospects for long-term returns between 4%-5% on high quality bonds, we remain cautious on credit due to rich valuations. Credit spreads reflect the extra compensation above Treasuries that investors demand to own bonds subject to the credit risk of the issuer. The chart below [Figure 2] shows how most credit sectors offer poor compensation compared to history. Both investment grade (IG) and high yield (HY) corporate bond spreads are in the richest 1% vs. the last 10 years.
![]()
Narrow credit spreads are supported by the resilient economy, strong corporate fundamentals, and healthy demand from investors, but IG spreads tighter than 0.80% are rare, suggesting limited opportunity for further compression. Historically, spreads above 1% are associated with outperformance vs. U.S. Treasuries.
While spreads on mortgage bonds guaranteed by government-supported Ginnie Mae, Fannie Mae, and Freddie Mac look attractive on their surface, investors in these sectors need to account for prepayment risk if long-term rates decline and borrowers refinance their mortgages. We continue to favor credit sectors tied to the strength of the consumer with less prepayment risk, including non-agency mortgages, commercial mortgage-backed securities, and asset backed securities. Taxable municipal bonds, while fully valued, offer a high-quality alternative to Treasuries with stable revenue streams.
Tax-Exempt Municipals Attractive
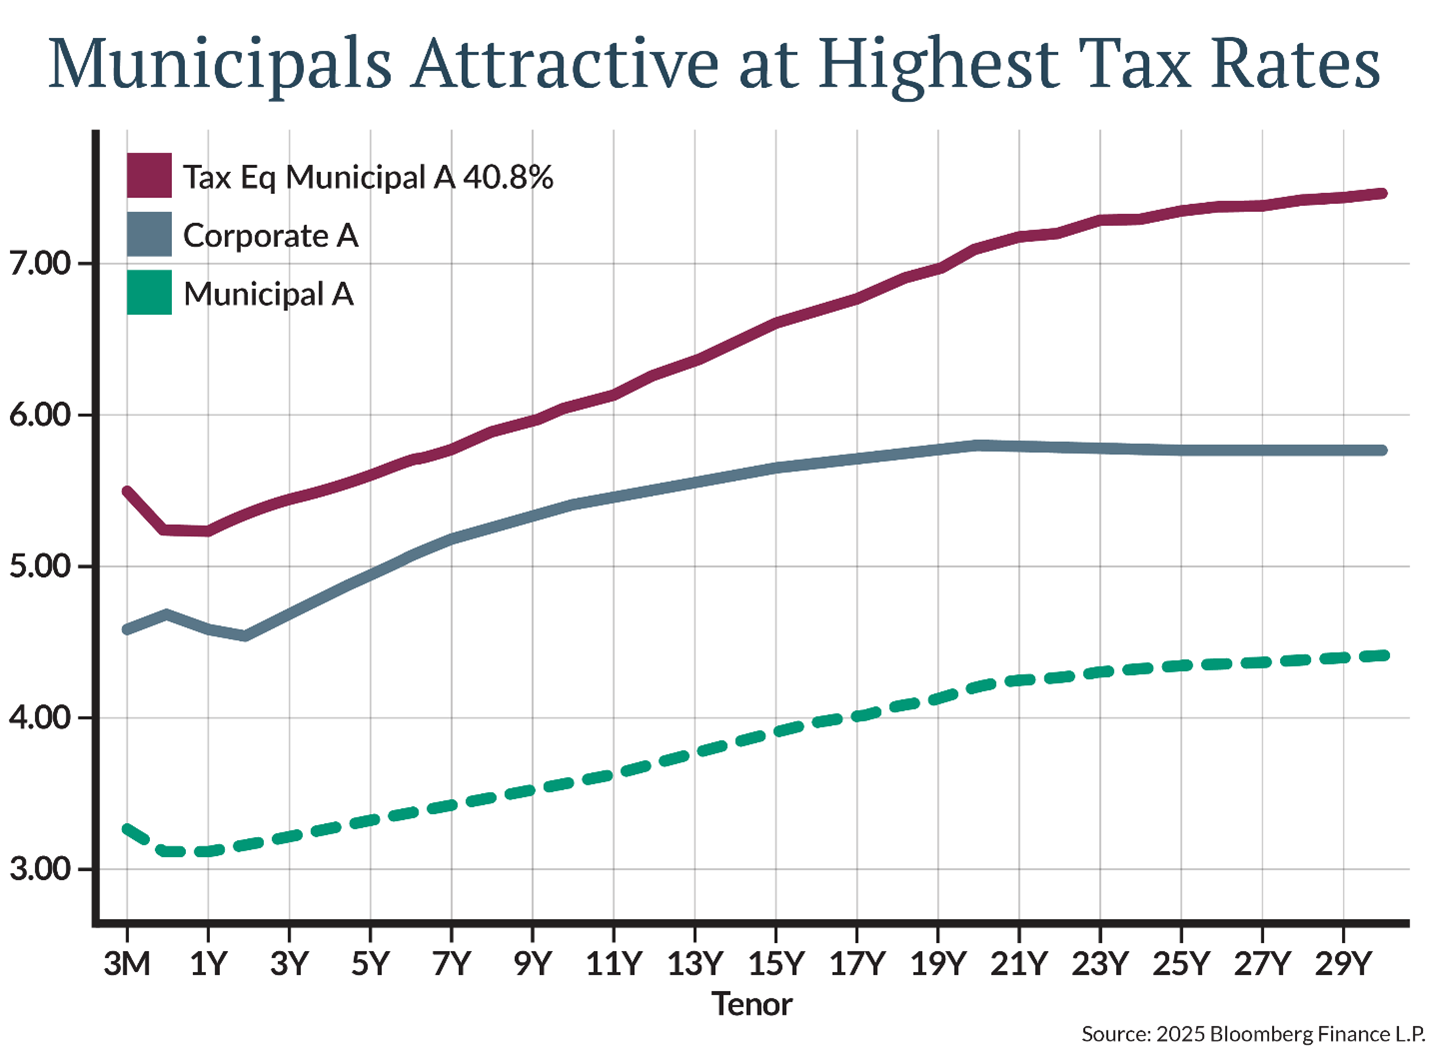
We believe tax-exempt municipal bonds offer compelling value, with taxable equivalent yields approaching 6-7% for investors subject to the highest tax brackets [Figure 3]. Here it should be noted that as rates rise, so too does the value of tax exemption. A 3% tax-exempt yield is equivalent to about 5% taxable for an investor subject to the highest 40.8% tax, a gain of two percentage points over the nominal yield. At a 4% nominal yield, the taxable equivalent yield is about 6.67%, a gain of 2.67 percentage points over the nominal yield.
Although state and local finances peaked with pandemic stimulus, state reserves are still strong, and economic resilience should keep tax receipts healthy. Proposed tax policy changes could result in periods of volatility, but we believe higher yields or widening credit spreads are likely to be met by robust demand.
Opportunity Amid Uncertainty
We believe rising yields in recent months are largely due to policy uncertainty. Investors and the Fed are unsure if Trump’s tariffs, tax cuts, and immigration curbs will reignite inflation. This has pushed yields into the highest decile of cheapness since the global financial crisis.
While inflation has been sticky in recent months, the overall trend is down, and the Fed has demonstrated a commitment to keep interest rates in restrictive territory until more progress has been made. We therefore view the current opportunity to add high quality bonds well above long-term inflation as an attractive one. With equity valuations high and dividend yields low, today’s bonds yields offer investors an incentive to diversify. We believe investors should take advantage.
This information is for educational and illustrative purposes only and should not be used or construed as financial advice, an offer to sell, a solicitation, an offer to buy or a recommendation for any security. Opinions expressed herein are as of the date of this report and do not necessarily represent the views of Johnson Financial Group and/or its affiliates. Johnson Financial Group and/or its affiliates may issue reports or have opinions that are inconsistent with this report. Johnson Financial Group and/or its affiliates do not warrant the accuracy or completeness of information contained herein. Such information is subject to change without notice and is not intended to influence your investment decisions. Johnson Financial Group and/or its affiliates do not provide legal or tax advice to clients. You should review your particular circumstances with your independent legal and tax advisors. Whether any planned tax result is realized by you depends on the specific facts of your own situation at the time your taxes are prepared. Past performance is no guarantee of future results. All performance data, while deemed obtained from reliable sources, are not guaranteed for accuracy. Not for use as a primary basis of investment decisions. Not to be construed to meet the needs of any particular investor. Asset allocation and diversification do not assure or guarantee better performance and cannot eliminate the risk of investment losses. Certain investments, like real estate, equity investments and fixed income securities, carry a certain degree of risk and may not be suitable for all investors. An investor could lose all or a substantial amount of his or her investment. Johnson Financial Group is the parent company of Johnson Bank, Johnson Wealth Inc. and Johnson Insurance Services LLC. NOT FDIC INSURED * NO BANK GUARANTEE * MAY LOSE VALUE
ABOUT THE AUTHOR